Creating a monitoring dashboard with a Grafana using Prometheus and Node Exporter
Creating a monitoring dashboard with a Grafana
using Prometheus and Node Exporter
To get an instance that works correctly. Clone this repository
grafana-prometheus-node-exporter/docker-compose.yml
at main · R3m1xed/grafana-prometheus-node-exporter · GitHub
Run : git clone grafana-prometheus-node-exporter/docker-compose.yml
at main · R3m1xed/grafana-prometheus-node-exporter · GitHub
Cd into the correct directory and run:
docker compose up -d
Once it is up and running. In a browser navigate to http://<hostip>:
3000
The credentials will be admin:admin, change your password
then log into the dashboard.
Up on the top left, click on the icon to the left of home
and click on Connect data under connections.
In the search box, type in Prometheus and click on Prometheus,
you will be taken to another page where we can add a data source for Prometheus
Note: if Prometheus is not installed, this page will
allow you to install it.
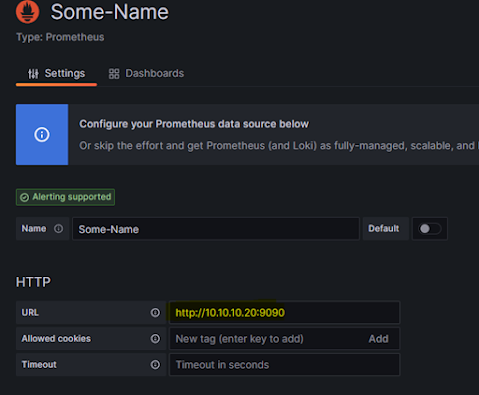
Click on create a Prometheus data source.
At this point here, the part that is important to get it
connected, is providing url with its port to let it find Node Exporter.
You can fill out the other information as you see fit.
After you are done with this page scroll down the bottom and
click Save & Test
Prometheus container
Now we need to get into the prometheus container and edit
/etc/prometheus/prometheus.yml
You can do these multiple ways (docker container exec
(container) sh – this gives a shell), but at the bottom of the file, add
the following:
- job_name: "hostmachine"
static_configs:
- targets: ['<ipaddress>':9100']
Once this is done we will need to restart the container, go back to original
docker compose file location and run the following:
docker compose down
docker compose up -d
Creating a dashboard
Go back the Grafana main page on port 3000 and click on dashboard.
Now click on new -> new dashboard
Click on add visualization.
Now you should be brought to this screen.
For keeping this simple and easy to understand. The query we
are going to run checks available ram.
The following is needed to make this work:
Data Source: needs to be the prometheus datasoruce you
configured earlier.
Metrics browser: node_memory_MemFree_bytes
Click on run queries to make sure it works.
If it has worked. Click save up the top right.
Navigate to where you saved your dashboard, and you should something
similar to this (note: I have 2 hosts being read with node exporter, so as
long as you have you have some data showing it should be working correctly).


Comments
Post a Comment